Operations in 2015
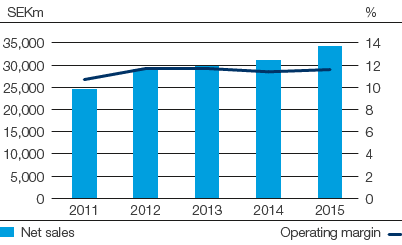
Net sales rose 11% to SEK 34,344m (31,066). Organic sales growth, which excludes exchange rate effects, acquisitions and divestments, was 7%, of which volume accounted for 4% and price/mix for 3%. Organic sales growth was 4% in mature markets and 12% in emerging markets. Emerging markets accounted for 43% of sales. Exchange rate effects increased sales by 4%.
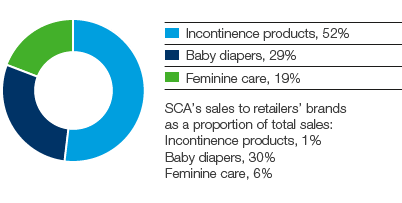
For incontinence products, under the globally leading TENA brand, organic sales growth was 4%. Growth is attributable to emerging markets and Western Europe, which compensated for lower sales in North America. For baby diapers, organic sales growth was 7%. Growth is mainly attributable to Europe. For feminine care products, organic sales growth was 18%, attributable to emerging markets and Western Europe.
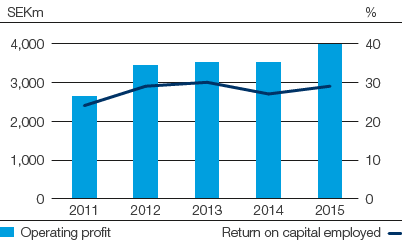
Operating profit, excluding items affecting comparability, rose 13% (12% excluding currency translation effects) to SEK 3,990m (3,526). Profit was favorably affected by a better price/mix, higher volumes and cost savings. Higher raw material costs mainly resulting from the stronger US dollar had a negative earnings impact. Investments were made in increased marketing activities for incontinence products and in India.
The operating margin 1) was 11.6% (11.4).
Return on capital employed 1) was 29.2% (27.3).
The operating cash surplus amounted to SEK 5,018m (4,511). Operating cash flow increased to SEK 3,792m (3,345).
Capital expenditures amounted to SEK 1,743m (1,530).
Operating profit 1), SEKm:
3,990
Operating margin 1):
11.6%
Net sales and operating margin

Excluding items affecting comparability.
2012 and 2013 restated in accordance with IFRS 10 and 11.
SEKm |
2015 |
2014 |
||
|
||||
Net sales |
34,344 |
31,066 |
||
Operating cash surplus |
5,018 |
4,511 |
||
Change in working capital |
–314 |
–96 |
||
Current capital expenditures, net |
–840 |
–884 |
||
Other operating cash flow |
–72 |
–186 |
||
Operating cash flow |
3,792 |
3,345 |
||
Operating profit 1) |
3,990 |
3,526 |
||
Operating margin, % 1) |
12 |
11 |
||
Capital employed |
13,148 |
13,578 |
||
Return on capital employed, % 1) |
29 |
27 |
||
Strategic capital expenditures |
|
|
||
plant and equipment |
–903 |
–646 |
||
company acquisitions/divestments |
23 |
–567 |
||
Average number of employees |
12,688 |
12,988 |
||
No. of employees at Dec. 31 |
12,700 |
12,641 |
||
Operating profit and return on capital employed

Excluding items affecting comparability.
2012 and 2013 restated in accordance with IFRS 10 and 11.
TARGETS
- Return on capital employed of 30% over a business cycle
- Annual organic sales growth of 5–7%
SCA’s sales by product segment

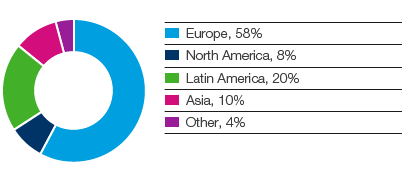
Emerging markets accounted for
43%
of the business area’s sales in 2015 and reported organic sales growth of 12% for the year.
SCA’s sales by region

1) Excluding items affecting comparability.