Operations in 2015
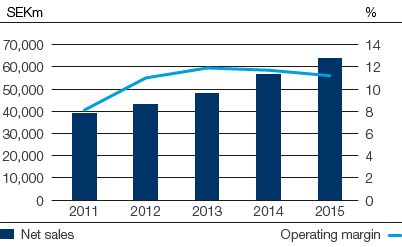
Net sales rose 13% to SEK 64,184m (56,994). Organic sales growth, which excludes exchange rate effects, acquisitions and divestments, was 5%, of which volume accounted for 3% and price/mix for 2%. Organic sales growth was 1% in mature markets and 13% in emerging markets. Emerging markets accounted for 32% of sales. Exchange rate effects increased sales by 8%.
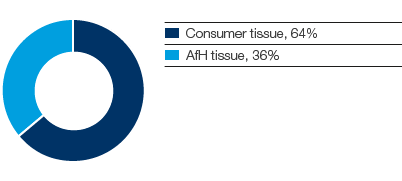
For consumer tissue, organic sales growth was 6%. Growth is related to high growth in emerging markets, particularly China, and higher sales in Western Europe. For AfH tissue, organic sales growth was 2%. The increase was related to emerging markets and North America.
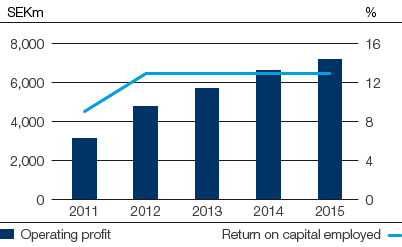
Operating profit, excluding items affecting comparability, rose 8% (0% excluding currency translation effects) to SEK 7,217m (6,652). A better price/mix, higher volumes and cost savings contributed to the earnings increase. Higher raw material costs mainly resulting from the stronger US dollar had a negative earnings impact.
The operating margin 1) was 11.2% (11.7).
The return on capital employed 1) was 12.9% (12.6).
Operating cash surplus increased to SEK 10,703m (9,760). Operating cash flow increased to SEK 7,667m (7,343).
Capital expenditures in non-current assets amounted to SEK 3,536m (2,835).
Operating profit 1), SEKm:
7,217
Operating margin 1):
11.2%
Net sales and operating margin

Excluding items affecting comparability.
2012 and 2013 restated in accordance with IFRS 10 and 11.
SEKm |
2015 |
2014 |
||
|
||||
Net sales |
64,184 |
56,994 |
||
Operating cash surplus |
10,703 |
9,760 |
||
Change in working capital |
–285 |
55 |
||
Current capital expenditures, net |
–2,260 |
–1,849 |
||
Other operating cash flow |
–491 |
–623 |
||
Operating cash flow |
7,667 |
7,343 |
||
Operating profit 1) |
7,217 |
6,652 |
||
Operating margin, % 1) |
11 |
12 |
||
Capital employed |
55,053 |
55,489 |
||
Return on capital employed, % 1) |
13 |
13 |
||
Strategic capital expenditures |
|
|
||
plant and equipment |
–1,276 |
–986 |
||
company acquisitions/divestments |
0 |
283 |
||
Average number of employees |
27,210 |
26,966 |
||
No. of employees at Dec. 31 |
27,024 |
26,997 |
||
Operating profit and return on capital employed

Excluding items affecting comparability.
2012 and 2013 restated in accordance with IFRS 10 and 11.
TARGET
- Return on capital employed of 15% over a business cycle.
- Annual organic sales growth of 3–4%.
SCA’s sales by product segment

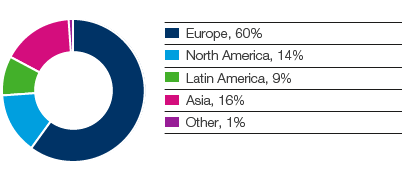
Emerging markets accounted for
32%
of the business area’s sales in 2015 and reported organic sales growth of 13% for the year.
SCA’s sales by region

1) Excluding items affecting comparability.