C2. Personnel data
|
2015 |
2014 |
2013 |
|
|
|
|
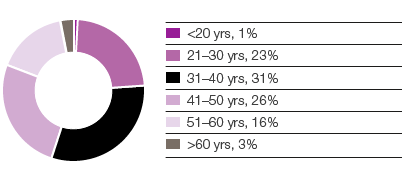
Employees under 20 years of age, % |
1 |
2 |
2 |
Employees over 60 years of age, % |
3 |
3 |
3 |
Investments in skills-enhancement activities |
|
|
|
total, SEKm |
157 |
130 |
117 |
per employee, SEK |
3,500 |
2,900 |
3,200 |
Value added per employee, KSEK |
668 |
614 |
678 |
Proportion of university graduates, % |
22 |
20 |
18 |
Number of employees who left the Group during the period |
5,600 |
8,355 |
5,495 |
Number of employees who joined the Group during the period |
5,988 |
7,319 |
4,887 |
These figures include both voluntary retirement and the effects of rationalization activities and retirements. In addition, a significant portion relates to summer jobs for students and seasonal work.
From 2014, the information about personnel costs was noticeably impacted by the Group’s acquisition of Vinda.
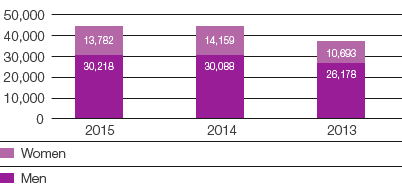
Average number of employees

Age distribution 2015

In 2015, SCA had employees in 61 countries (62; 61). Women comprised 39% (21; 21) of the total number of SCA Board members elected by the Annual General Meeting and senior executives.