Financial position
Assets and capital employed
The Group’s total assets declined 2% compared with the preceding year, amounting to SEK 152,372m (154,736). Non-current assets decreased SEK 4,243m compared with the preceding year to SEK 111,242m, of which property, plant and equipment declined SEK 1,379m to SEK 84,651m and intangible assets declined SEK 828m to SEK 22,852m. Current and strategic capital expenditures in property, plant and equipment amounted to SEK 7,333m and depreciation for the year to SEK 5,668m.
Current assets rose SEK 1,879m to SEK 41,130m (39,251). Working capital amounted to SEK 8,167m (8,350). Capital employed was 3% lower than in the preceding year and totaled SEK 105,169m (108,819). The distribution of capital employed per currency is shown in the table below.
The value denominated in SEK of the Group’s foreign net assets amounted to SEK 62,196m at year-end. In 2014, the Group’s foreign net assets totaled SEK 57,922m.
Equity
Consolidated equity amounted to SEK 75,691m (72,872) at year-end. Net profit for the period increased equity by SEK 7,452m (7,068), while shareholder dividends decreased equity by SEK 3,903m (3,564). Equity rose SEK 2,004m after tax due to remeasurements of the net pension liability to fair value. Fair value measurement of financial instruments decreased equity by SEK 774m after tax. Exchange rate movements, including the effect of hedges of net foreign investments, after tax, decreased equity by SEK 1,920m. Acquisitions of non-controlling interests decreased equity by SEK 19m.
Financing
The Group’s interest-bearing gross debt amounted to SEK 33,822m (38,886) at year-end. The maturity period was 3.4 (2.5) years.
Net debt amounted to SEK 29,478m (35,947) at year-end. Net cash flow decreased net debt by SEK 3,098m. Furthermore, net debt declined by SEK 1,910m as a result of fair value measurement of pension assets and pension obligations, together with fair valuation of financial instruments. Exchange rate movements decreased net debt by SEK 1,461m.
Key figures
The debt/equity ratio was 0.39 (0.49). Excluding pension liabilities, the debt/equity ratio was 0.36 (0.42). The visible equity/assets ratio was 46% (44). The return on capital employed (ROCE) and on equity (ROE), excluding items affecting comparability, amounted to 12% (11) and 12% (12), respectively. The capital turnover rate was 1.06 (0.99). At year-end, working capital amounted to 7% (8) of net sales.
|
2015 |
% |
2014 |
% |
2013 1) |
% |
||
|
||||||||
EUR |
24,097 |
23 |
31,037 |
29 |
27,393 |
27 |
||
SEK |
39,464 |
38 |
36,337 |
33 |
36,627 |
36 |
||
USD |
7,124 |
7 |
7,192 |
7 |
6,145 |
6 |
||
GBP |
4,879 |
5 |
5,452 |
5 |
4,894 |
5 |
||
Other |
29,605 |
27 |
28,801 |
26 |
26,671 |
26 |
||
Sweden |
105,169 |
100 |
108,819 |
100 |
101,730 |
100 |
||
SEKm |
2015 |
2014 |
2013 1) |
||
|
|||||
Intangible assets |
22,852 |
23,680 |
21,921 |
||
Property, plant and equipment |
54,532 |
56,345 |
52,777 |
||
Biological assets |
30,119 |
29,685 |
28,767 |
||
Other non-current assets |
3,739 |
5,775 |
6,081 |
||
Total non-current assets |
111,242 |
115,485 |
109,546 |
||
Current assets |
41,130 |
39,251 |
35,430 |
||
Total assets |
152,372 |
154,736 |
144,976 |
||
Equity |
75,691 |
72,872 |
67,811 |
||
Non-current liabilities |
36,481 |
40,347 |
42,375 |
||
Current liabilities |
40,200 |
41,517 |
34,790 |
||
Total equity and liabilities |
152,372 |
154,736 |
144,976 |
||
Working capital |
8,167 |
8,350 |
7,740 |
||
Capital employed |
105,169 |
108,819 |
101,730 |
||
Net debt |
29,478 |
35,947 |
33,919 |
||
Net debt, debt/equity ratio and debt payment capacity
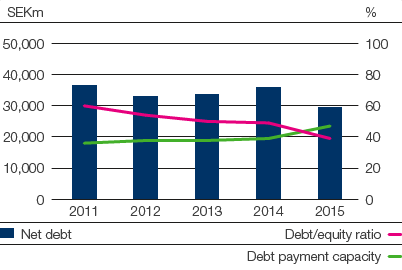

2012 and 2013 restated in accordance with IFRS 10 and 11.
Return on capital employed and
equity
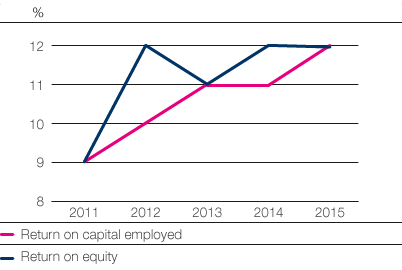

Excluding items affecting comparability.
2012 and 2013 restated in accordance with IFRS 10 and 11.
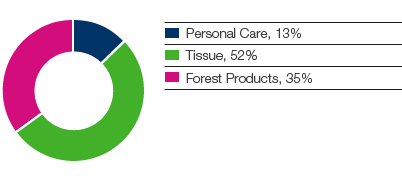
Capital employed, share of Group