Operating cash flow
A high level of control of the operating cash flow is a key part of SCA’s long-term competitiveness strategy. Operating cash flow amounted to SEK 14,948m (12,921). The increase is primarily attributable to changes in working capital and a higher operating cash surplus compared with the preceding year.
The operating cash surplus rose 6% to SEK 19,343m (18,312). Working capital decreased due to increased trade payables and other current liabilities. Working capital in proportion to net sales amounted to 6% (7). Current capital expenditures increased SEK 1,019m during the year and amounted to SEK 5,181m (4,162), corresponding to 4% (4) of net sales. Operating cash flow increased to SEK 14,948m (12,921).
Financial items decreased SEK 36m to SEK –919m (–955). The decrease was attributable to lower interest payments and positive translation effects. Tax payments totaled SEK 3,799m (2,208). Cash flow from current operations amounted to SEK 10,382m (9,890).
Strategic capital expenditures in non-current assets made to strengthen organic growth totaled SEK 4,264m (3,125). The year’s expense for strategic capital expenditures was mainly related to investments in increased capacity at the Östrand pulp mill in Sweden and investments in a new production plant for incontinence products in Brazil.
Net debt increased SEK 5,883m during the year to SEK 35,361m at year-end. Net cash flow increased net debt by SEK 3,784m. Fair value measurement of pension assets and an update of the assumptions and assessments that influence the valuation of pension obligations, net, together with fair valuation of financial instruments, increased net debt by SEK 1,526m. The effect of fair value measurement is largely attributable to assumptions of a lower discount rate that increases pension liabilities. Exchange rate movements increased net debt by SEK 573m.
The debt/equity ratio was 0.44 (0.39). Excluding pension liabilities, the debt/equity ratio was 0.39 (0.36). The debt payment capacity was 40% (47).
SEKm |
2016 |
2015 |
2014 |
Operating cash surplus |
19,343 |
18,312 |
16,250 |
Change in working capital |
1,970 |
–399 |
–446 |
Current capital expenditures, net |
–5,181 |
–4,162 |
–3,737 |
Restructuring costs, etc. |
–1,184 |
–830 |
–883 |
Operating cash flow |
14,948 |
12,921 |
11,184 |
Financial items |
–919 |
–955 |
–961 |
Income taxes paid, etc. |
–3,647 |
–2,076 |
–2,074 |
Cash flow from current operations |
10,382 |
9,890 |
8,149 |
Company acquisitions |
–6,598 |
–93 |
–508 |
Strategic capital expenditures in non-current assets |
–4,264 |
–3,125 |
–1,816 |
Divestments |
489 |
329 |
206 |
Cash flow before dividend |
9 |
7,001 |
6,031 |
The Group’s cash flow
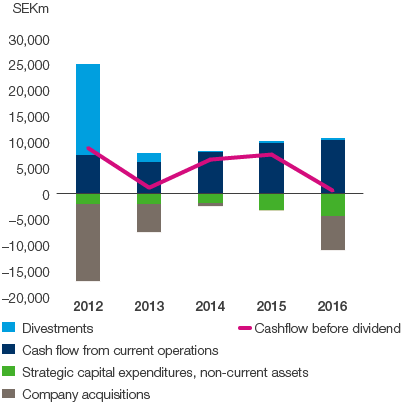

2012 and 2013 restated in accordance with IFRS 10 and 11.
Capital expenditures
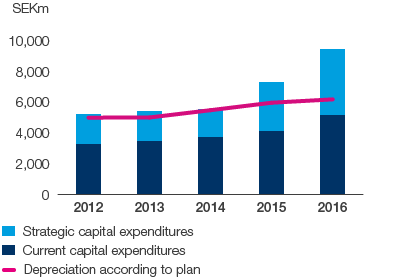

2012 and 2013 restated in accordance with IFRS 10 and 11.
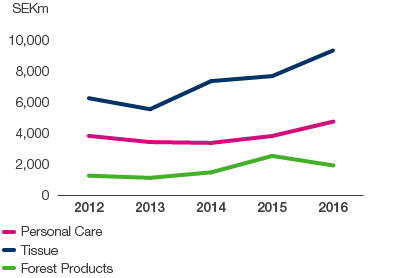
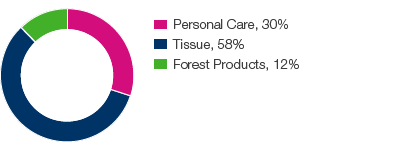
Operating cash flow, share of Group

Operating cash flow by business area