The Resource Management System, RMS
SCA operates an extensive system for gathering and presenting data for individual production facilities and entire business units. The Resource Management System (RMS) allows SCA to analyze data, describing how the company uses energy, water, transport and raw materials, and to monitor waste and emissions levels.
The RMS data is used for internal control and monitoring, external benchmarking and as a tool for evaluating acquisitions and major investments. This year’s RMS data includes two new tissue plants. One tissue plant and three personal care plants were excluded from the data.
Resources
This section describes SCA’s use of raw materials, water, energy and transport in 2016.
Raw materials
Distribution of raw materials
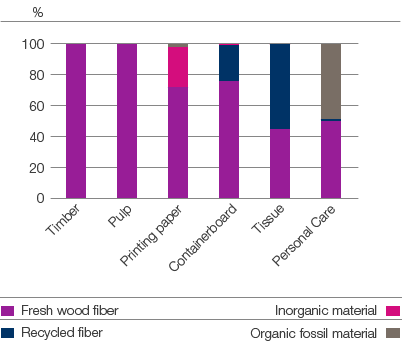

A typical SCA product is made from various types of wood fiber. It also contains small amounts of inorganic and fossil organic materials.
Renewable raw materials (fresh fiber and recycled fiber) account for the largest share of the material used in an average SCA product. Inorganic materials (kaolin clay and calcium carbonate) are used as filler and coating pigment in certain types of paper in order to satisfy high customer quality requirements. Synthetic materials are used in highly absorbent hygiene products to improve quality and function. The diagram to the right shows the raw material distribution of SCA’s products.
Water
SCA’s water supply is presented in the table “Raw materials, energy and emissions”. The figures stated are totals for surface water, groundwater and municipal water systems. SCA’s total water intake amounted to 216 Mm3.
Energy
Energy use includes purchased energy (heating, electricity and fuel) supplied to production units, energy generated from wood, liquor, bark, sludge and waste paper, and electricity generated on site. A large portion of the energy used by SCA comes from the incineration of wood residuals and from on-site co-generation of electricity. The energy data figures stated therefore include both a fuel component and an electricity component.
Any excess electricity produced at an SCA facility that is not used internally is supplied to the national grid. In 2016, SCA delivered 33.8 GWh of electricity to the national grid.
SCA supplies secondary heat derived from effluent hot water to district heating systems, mainly in Sweden, which is an effective way of saving energy. In 2016, SCA delivered heat to district heating systems equivalent to 47,142 cubic meters of fuel oil.
Distribution of water supply


Distribution of electricity supply


Transport
Raw materials are transported to SCA’s production plants and finished products are delivered to SCA’s customers. SCA uses external suppliers for most of its transportation needs. SCA’s use of transportation is equivalent to 30.3 billion ton-kilometers. Sea freight accounts for the greatest portion of SCA’s transport and the remainder consists of road and rail. Transportation of SCA’s raw materials and products uses the equivalent of 11,852 TJ of fuel and electricity.
Transport work declined 4% compared with 2015, mainly due to the closure of a paper machine at the Ortviken mill in early 2016.
Distribution of transport usage


Distribution of fuel supply


Emissions
The company’s total emissions are determined by fuel consumption, which in turn is determined by the level of production. Changes in production volumes over the past few years is measured in tons and cubic meters. The SCA Group’s emissions are shown in the tables that present Group emissions in 2014, 2015 and 2016.
Emissions to air
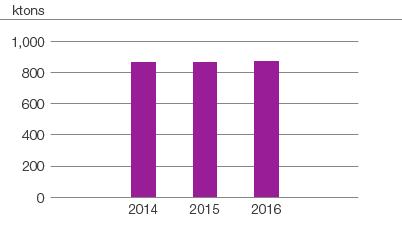
Air emissions, CO2 fossil

Air emissions comprise emissions from all combustion units at SCA’s production sites, including fossil fuel and biofuel emissions and emissions from purchased thermal energy. When energy (primarily thermal energy and/or electricity) is supplied to an external facility, air emissions are reduced in relation to the energy amount delivered and the reduction is distributed among SCA’s main products.
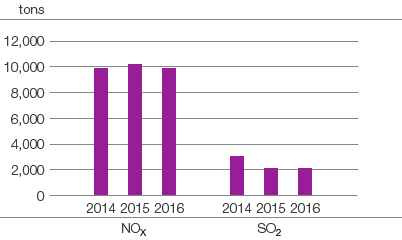
Three chemical compounds are measured and reported in relation to air emissions: NOX, SO2 and fossil CO2.
SCA uses Group-wide established procedures and principles for calculating RMS data so as to create comparability.
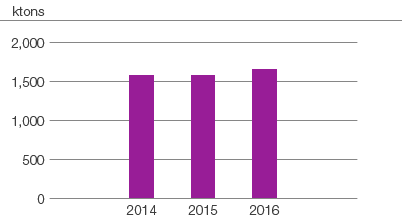
CO2 emissions from SCA’s use of fossil fuels corresponded to 1,672 ktons and purchased electricity to 1,451 ktons during the year.
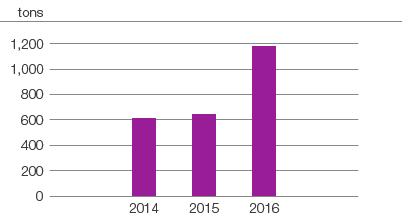
The increase in SO2 was due to the acquisition of North American tissue company Wausau and the expansion investment in the Östrand pulp mill in Sweden.
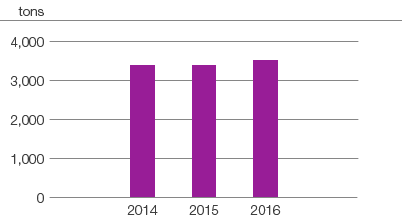
Air emissions, NOX

Air emissions, SO2

Air emissions from transport
A large portion of SCA’s air emissions is generated by transport, rather than the company’s production activities. Transport emissions are not included in the table “Raw materials, energy, and emissions” in chapter Environmental data, but are presented in the diagrams below.
Emissions from transport, CO2

Emissions from transport, NOX and SO2

Emissions to water
SCA’s effluent water is divided into cooling water and process water. Cooling water has simply been heated and is not contaminated in any way. The total volume of discharged process water is 116 Mm3. This water is treated using methods similar to those employed at municipal wastewater treatment facilities. The figures for 2016 refer to process water emissions.
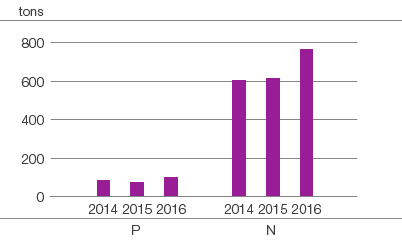
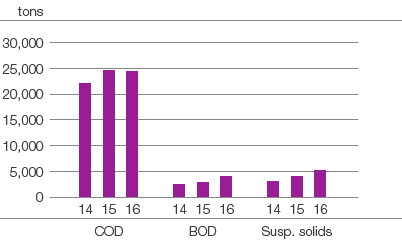
The emissions to water stated in the tables comprise COD, BOD, suspended solids, AOX, P and N. Measurement methods differ in some respects.
During the year, SCA’s emissions to water (COD, BOD, suspended solids and N) increased due to installation of a new water treatment plant in Munksund, Sweden, rebuilding of a biological water treatment plant in Östrand, Sweden and technical problems at the Obbola plant in Sweden.
Water effluents, P, N

Water effluents, COD, BOD and suspended solids

Solid waste
Distribution of solid waste
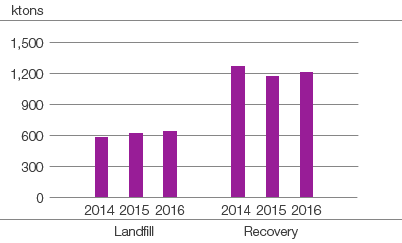

The solid waste reported by SCA is waste that is sent to landfill, recycled waste and hazardous waste. Recycled waste refers to materials that can be used as raw materials in other industries, such as the cement, brick-making and construction industries. The main types of recycled waste are ash, sludge, organic waste and plastics. Hazardous waste is primarily waste oil as well as organic solvents, batteries and strip lights.