Key figures
All earnings figures include items affecting comparability unless otherwise indicated. |
|||||||||||||||||||
SEK per share unless otherwise indicated |
2016 |
2015 |
2014 |
2013 |
2012 |
||||||||||||||
|
|||||||||||||||||||
Earnings per share after full tax: |
|
|
|
|
|
||||||||||||||
After dilution |
7.93 |
9.97 |
9.40 |
7.90 |
7.06 |
||||||||||||||
After dilution, excluding items affecting comparability 7) |
11.18 |
11.82 |
11.07 |
9.07 |
10.25 |
||||||||||||||
Before dilution |
7.93 |
9.97 |
9.40 |
7.90 |
7.06 |
||||||||||||||
Market price for B share: |
|
|
|
|
|
||||||||||||||
Average price during the year |
253.73 |
222.03 |
178.87 |
168.27 |
116.77 |
||||||||||||||
Closing price, December 31 |
257.30 |
246.50 |
168.90 |
198.00 |
141.00 |
||||||||||||||
Cash flow from current operations 1) 7) |
14.78 |
14.08 |
11.60 |
8.90 |
10.59 |
||||||||||||||
Cash flow from operating activities |
22.15 |
19.92 |
16.92 |
13.43 |
15.95 |
||||||||||||||
Dividend |
6.00 2) |
5.75 |
5.25 |
4.75 |
4.50 |
||||||||||||||
Dividend growth, % 3) |
7 |
8 |
7 |
6 |
0 |
||||||||||||||
Dividend yield, % |
2.3 |
2.3 |
3.1 |
2.4 |
3.2 |
||||||||||||||
P/E ratio 4) |
32 |
25 |
18 |
25 |
20 |
||||||||||||||
P/E ratio, excluding items affecting comparability 4) 7) |
23 |
21 |
15 |
22 |
14 |
||||||||||||||
Price/EBIT 5) 7) |
19 |
19 |
15 |
19 |
21 |
||||||||||||||
Price/EBIT, excluding items affecting comparability 5) 7) |
15 |
16 |
14 |
17 |
15 |
||||||||||||||
Beta coefficient 6) |
0.70 |
0.70 |
0.77 |
0.62 |
0.86 |
||||||||||||||
Pay-out ratio (before dilution), % |
76 |
58 |
56 |
60 |
64 |
||||||||||||||
Equity, after dilution 7) |
113 |
107 |
103 |
96 |
88 |
||||||||||||||
Equity, before dilution 7) |
113 |
107 |
103 |
96 |
88 |
||||||||||||||
Number of registered shares December 31 (millions) |
705.1 |
705.1 |
705.1 |
705.1 |
705.1 |
||||||||||||||
of which treasury shares (millions) |
2.8 |
2.8 |
2.8 |
2.8 |
2.8 |
||||||||||||||
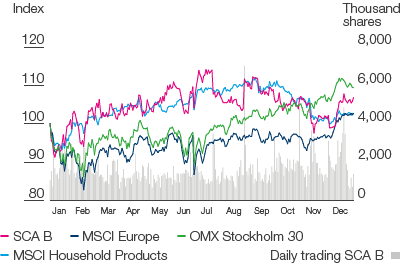
Total shareholder return 2016

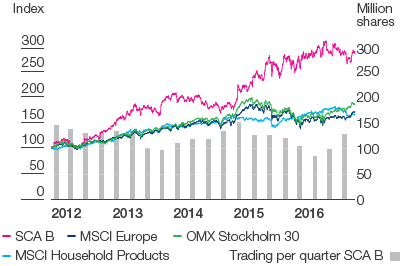
Total shareholder return 2012–2016

Earnings per share, 2016
7.93
SEK
Proposed dividend per share, 2016
6.00
SEK
Total shareholder return 2014–2016
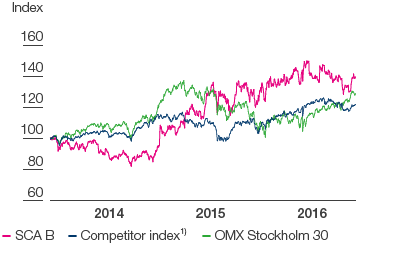

1) Weighted index of competitors’ total shareholder return. Competitors are selected to reflect SCA’s operations. The index is used when comparing the SCA share performance over a three-year term for the long-term portion (LTI) of senior executives’ variable remuneration.
Nasdaq Stockholm |
SCA A, SCA B |
New York (ADR level 1) |
SVCBY |
|
Class A |
Class B |
Total |
Number of registered shares |
64,594,572 |
640,515,522 |
705,110,094 |
– of which treasury shares |
|
2,767,605 |
2,767,605 |
Shareholders |
No. of A shares |
Number of B shares |
Votes (%) |
Capital (%) |
||
|
||||||
AB Industrivärden |
35,000,000 |
31,800,000 |
29.7% |
9.5% |
||
Norges Bank Investment Management |
8,066,000 |
31,220,168 |
8.7% |
5.6% |
||
SHB Oktogonen Foundation |
3,150,000 |
– |
2.4% |
0.4% |
||
Swedbank Robur Funds |
– |
27,442,314 |
2.1% |
3.9% |
||
Skandia |
2,038,110 |
908,021 |
1.7% |
0.4% |
||
AMF Insurance and Funds |
– |
18,859,380 |
1.5% |
2.7% |
||
SHB Pension Fund |
1,303,000 |
– |
1.0% |
0.2% |
||
SCA Employee Foundation |
982,845 |
74,406 |
0.8% |
0.1% |
||
SEB Funds |
– |
8,366,603 |
0.7% |
1.2% |
||
First Swedish Pension Insurance Fund |
– |
8,209,809 |
0.6% |
1.2% |
||
Holding |
No. of shareholders |
No. of shares |
Holding (%) |
Votes (%) |
||
|
||||||
1–500 |
53,287 |
8,731,480 |
1.2 |
1.5 |
||
501–1,000 |
11,937 |
9,165,432 |
1.3 |
1.5 |
||
1,001–5,000 |
12,839 |
27,788,369 |
3.9 |
4.7 |
||
5,001–10,000 |
1,741 |
12,497,397 |
1.8 |
2.0 |
||
10,001–20,000 |
769 |
11,009,058 |
1.6 |
1.5 |
||
20,001– |
1,276 |
635,918,358 |
90.2 |
88.8 |
||
Total |
81,849 |
705,110,094 |
100.0 |
100.0 |
||
Percentage of foreign ownership, capital
as of December 31, 2016
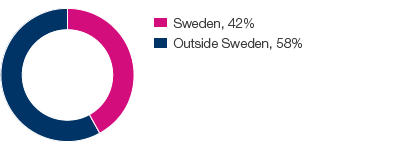

Source: Euroclear
|
|
No. of shares |
Increase in share capital, SEKm |
Cash payment, SEKm |
Class A |
Class B |
Total |
1993 |
Conversion of debentures and new subscription through Series 1 warrants |
4,030,286 |
40.3 |
119.1 |
|
|
|
|
New share issue 1:10, issue price SEK 80 |
17,633,412 |
176.3 |
1,410.7 |
62,145,880 |
131,821,657 |
193,967,537 |
1994 |
Conversion of debentures |
16,285 |
0.2 |
– |
62,145,880 |
131,837,942 |
193,983,822 |
1995 |
Conversion of debentures |
3,416,113 |
34.2 |
– |
62,145,880 |
135,254,055 |
197,399,935 |
1999 |
New share issue 1:6, issue price SEK 140 |
32,899,989 |
329.0 |
4,579.0 |
62,133,909 |
168,166,015 |
230,299,924 |
2000 |
Conversion of debentures |
101,631 |
1.0 |
15.0 |
61,626,133 |
168,775,422 |
230,401,555 |
2001 |
New issue, private placement |
1,800,000 |
18.0 |
18.0 |
45,787,127 |
186,414,428 |
232,201,555 |
2002 |
New subscription through IIB warrants |
513 |
0 |
0.1 |
41,701,362 |
190,500,706 |
232,202,068 |
2003 |
Conversion of debentures and subscriptions through IIB warrants |
2,825,475 |
28.3 |
722.9 |
40,437,203 |
194,590,340 |
235,027,543 |
2004 |
Conversion of debentures |
9,155 |
0.1 |
1.1 |
40,427,857 |
194,608,841 |
235,036,698 |
2007 |
Split 3:1 |
470,073,396 |
– |
– |
112,905,207 |
592,204,887 |
705,110,094 |