Operating cash flow
A high level of control of the operating cash flow is a key part of SCA’s long-term competitiveness strategy. Operating cash flow amounted to SEK 12,921m (11,184). The increase is primarily attributable to a higher operating cash surplus compared with the preceding year.
The operating cash surplus rose 13% to SEK 18,312m (16,250). Working capital increased due to higher inventory values and trade receivables. Working capital in proportion to net sales amounted to 7% (8). Current capital expenditures increased SEK 425m during the year and amounted to SEK 4,162m (3,737), corresponding to 4% (4) of net sales. Operating cash flow increased to SEK 12,921m (11,184).
Financial items decreased SEK 6m to SEK –955m (–961). The decrease was the result of lower average net debt, which compensated for somewhat higher interest rates during the year. Tax payments totaled SEK 2,208m (2,101). Cash flow from current operations amounted to SEK 9,890m (8,149).
Strategic capital expenditures in non-current assets made to strengthen organic growth totaled SEK 3,125m (1,816). The year’s expense for strategic capital expenditures pertained to for example investments in Forest Products in Sweden and Personal Care in Brazil.
Net debt declined SEK 6,469m during the year to SEK 29,478m at year-end. Net cash flow decreased net debt by SEK 3,098m. Fair value measurement of pension assets and pension obligations together with fair valuation of financial instruments decreased net debt by SEK 1,910m. Exchange rate movements decreased net debt by SEK 1,461m.
The debt/equity ratio amounted to 0.39 (0.49), while the Group’s debt payment capacity was 47% (39). Excluding pension liabilities, the debt/equity ratio was 0.36 (0.42).
SEKm |
2015 |
2014 |
2013 1) |
||
|
|||||
Operating cash surplus |
18,312 |
16,250 |
14,004 |
||
Change in working capital |
–399 |
–446 |
–328 |
||
Current capital expenditures, net |
–4,162 |
–3,737 |
–3,489 |
||
Restructuring costs, etc. |
–830 |
–883 |
–1,294 |
||
Operating cash flow |
12,921 |
11,184 |
8,893 |
||
Financial items |
–955 |
–961 |
–1,061 |
||
Income taxes paid, etc. |
–2,076 |
–2,074 |
–1,580 |
||
Cash flow from current operations |
9,890 |
8,149 |
6,252 |
||
Company acquisitions |
–93 |
–508 |
–5,488 |
||
Strategic capital expenditures in non-current assets |
–3,125 |
–1,816 |
–1,906 |
||
Divestments |
329 |
206 |
1,716 |
||
Cash flow before dividend |
7,001 |
6,031 |
574 |
||
The Group’s cash flow
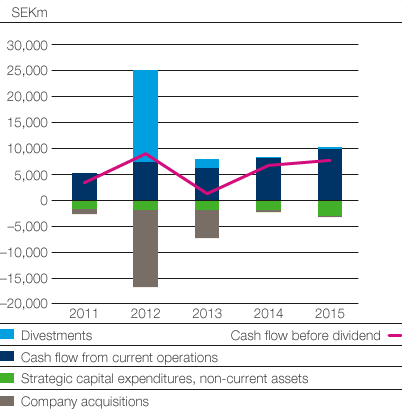

2012 and 2013 restated in accordance with IFRS 10 and 11.
Capital expenditures in non-current assets
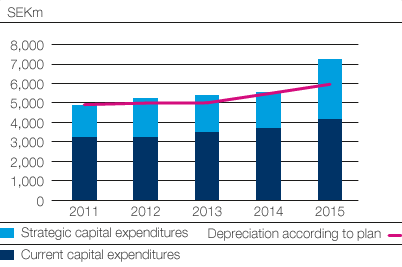

2012 and 2013 restated in accordance with IFRS 10 and 11.
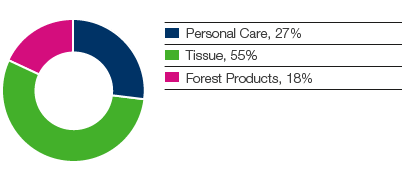
Operating cash flow by business area
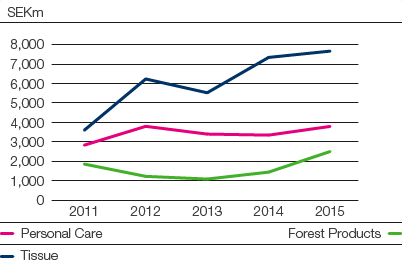

2012 and 2013 restated in accordance with IFRS 10 and 11.
Operating cash flow, share of Group